|
|
|
|
A. Objectives
B. Goals
C. In’s
D. Out’s
E. Step Diagram “Finding New sites for CGC in Portland Area”
F.
Step Diagram “Qualification of 150 CGC
in Portland Area”
|
|
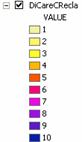
DiCareCRecla |
Reclassification of Distance of Care Centers |
|
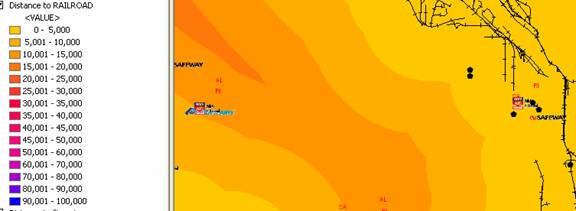
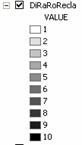
DiRaRoRecla |
Reclassification of Distance of Rail Roads |
|
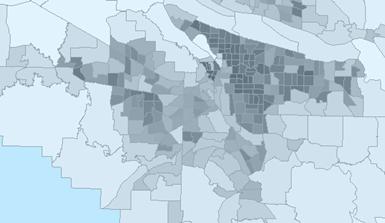
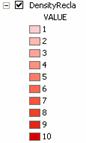
DensityRecla |
Reclassification of Density Population |
|
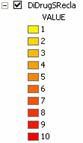
DiDrugSRecla |
Reclassification of Distance of Drugs Stores |
|
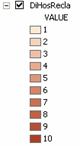
DiHosRecla |
Reclassification of Distance of Hospitals |
|
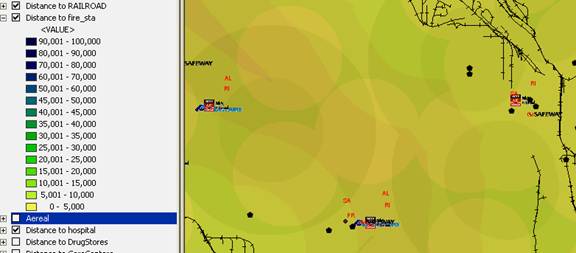
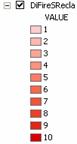
DiFireSRecla |
Reclassification of Distance of Fire Stations |
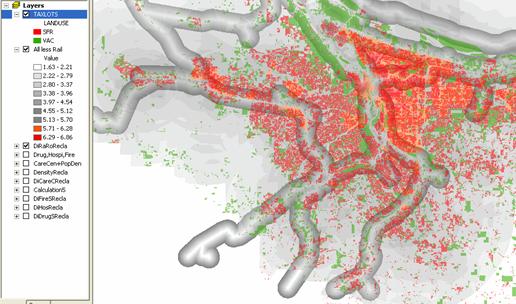
The result was the RAIL ROADS with a buffer.
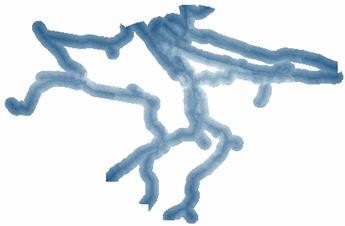
I did not understand the reason. So I tried
12.2. [DiCareCRecla] * .0859 - [DiRaRoRecla] * .2454 + [DensityRecla] * .2086 + [DiDrugSRecla] * .1227 + [DiHosRecla] * .1840 + [DiFireSRecla] * .1534
Gave the same
12.3. I took away Rail Road
[DiCareCRecla] * .0859 + [DensityRecla] * .2086 + [DiDrugSRecla] * .1227 + [DiHosRecla] * .1840 + [DiFireSRecla] * .1534
Gave this result. It was very
logical

12.4. I used again the Rail Road but divided by 10
[DiCareCRecla] * .0859 - [DiRaRoRecla] * .02454 + [DensityRecla] * .2086 + [DiDrugSRecla] * .1227 + [DiHosRecla] * .1840 + [DiFireSRecla] * .1534
Gave the same Rail Road
So I decided to utilize 12.3 and, in a posterior stage, consider the Rail Road Distance
12.5.
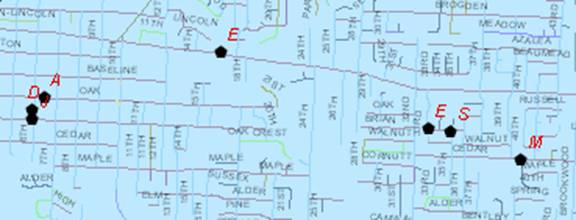
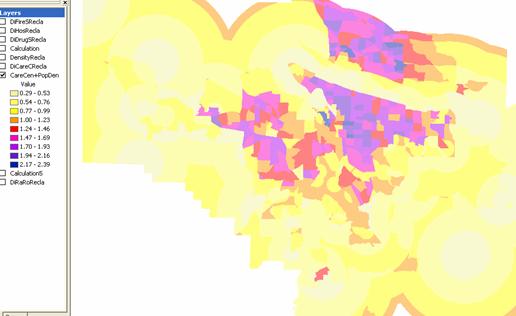
I did the calculation in 3 stages: The Distance between
Care Centers and the Population Density in step one. So the darkest are the
better areas
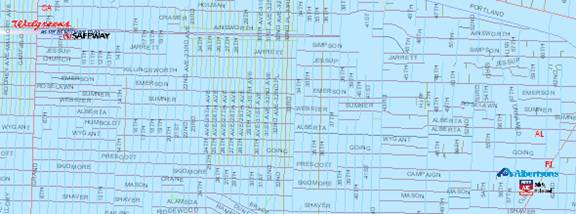
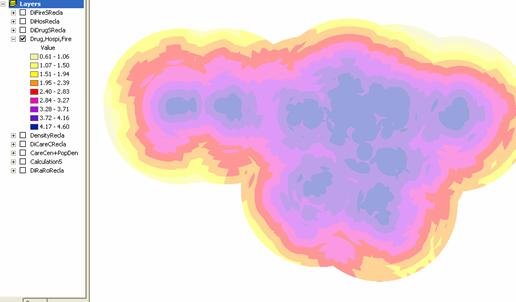
12.6.
The Distance between Drug Stores, Hospitals, Fire
Station. So the darkest area, are the better areas
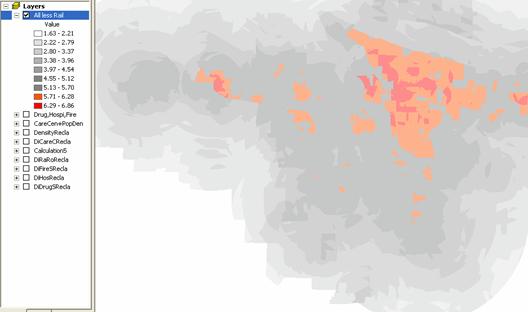
12.7.
I utilized the Raster Calculator with these last two
rasters. The Darkest area, the most suitable areas
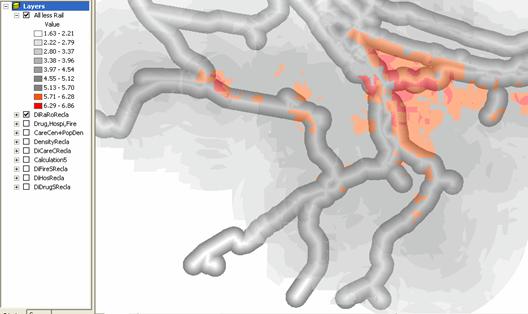
12.8.
I tried to rest the Rail Road to both
rasters. One more time, the result was illogical.
So I will take the Rail Roads into consideration later
12.9.
I
added Taxlots Only the lots type SFR y
VAC
13.
I reclassified the Raster for be able to be converted to
Polygon SHP
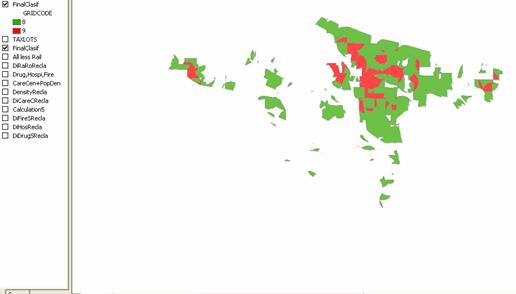
14. Using the Polygon file. I Select By Location from those lots type VAC that lied in my polygons type 9. I found 1647 lots. I added a field at TAXLOT table to give a mark to those 1,647 lots
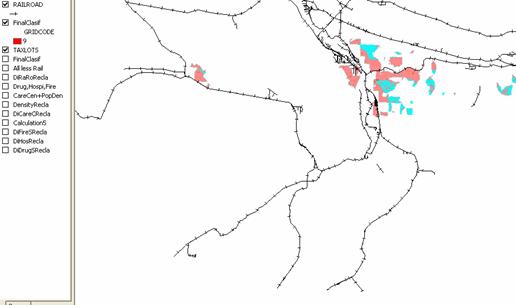
15. Here is my consideration to RAIL ROAD
From
those 1,647; I select from TAXLOTS those lots in a
distance of 5,000 ft or less. Resulting 1,030. I switched the selection and I
got 617 LOTS
16. I exported to ACCESS that table. I made the report of those lots between 10,000 and 15,000 sq ft in area. The report is the appendices 01. I am reporting only 11 lots from $32,000 to $212,000
In order to obtain the qualification, I felt was necessary to have information from every Care Giver Center distance to:
I was trying to do:
I Set up a ingenious way of obtaining the values:
1.
I added at the Care Giver Center Table 5 new fields ![]()
|
Field |
Type |
Information |
|
Hospi |
Large Integer |
CGC feet far away to Hospitals |
|
Firestat |
Large Integer |
CGC feet far away to Fire Station |
|
DrugS |
Large Integer |
CGC feet far away to Drug Stores |
|
Rail |
Large Integer |
CGC feet far away to Rail Road |
|
Tract |
Double |
In witch zone of density is settled the CGC |
2.
By ![]() of
Care Giver Center
of
Care Giver Center
2.1.
I found the max distance between
CGC and hospitals. It was 70,000 ft. So I actualized all the rows to
70,000 feet.

2.2. I tried again my select, but now with 60,000 ft. And I actualized all the selected rows with 60,000.
2.3. The same for 50,000 ft. …….. until 1,000 ft. So I obtained a distance scale of every CGC to hospitals.
3.
The same for Firestat,
DrugS, Rail For different values:

4.
In the case of Tract. In Properties of the layer I
settled a condition in ![]()

So, all the polygons were available to my SELECT BY
LOCATION. I ran the Select by Location and I actualize the entire field to
cero. I ran my ![]() in
Properties of TRACT with
in
Properties of TRACT with ![]() and
I ran the Select by Location and I actualize the entire field to 2.9. …..
until I finished in the follow table:
and
I ran the Select by Location and I actualize the entire field to 2.9. …..
until I finished in the follow table:

1.
As we can see in the following table, the data is quite
different ranges. Considering too that some data is distance and other is qty/area.

2.
I converted from ft to Mi. and I gave a Specific Weight
at every item. The bigger number, the mayor importance. The sum of all the
WEIGHTS is = 100.

3.
The Sum, Maxim, Minim, Average of every item was quit
different. It was necessary to classify the data. So I add the entire sum=2,407.
In the tract case, I divided 1,153/2,407= 0.48

 I
obtained the 12.53 in tract from divided 6/0.48
I
obtained the 12.53 in tract from divided 6/0.48
4.
Now, the data is classified. So I am giving importance
at the variations of the data. So now I can give qualification at every
occurrence. In the TRACT case, I considered negative its
contribution : 
In the case of RAIL ROAD I punished in great scale when the distance from
CGC to Rail Road was less or equal to 1,000 ft.
The second row (0.04) > 3,157 was obtained: from 4*34.48/0.0437=3,156.64
5. The final step was to sum the data to obtain a final qualification. I give classification, considering the range to give a MAX of 10 and a MIN of 1.
The entire table is an Addendum at this document


|
Last modified: 08/05/09 |
![[Under Construction]](images/undercon.gif)